What’s my DNS?

If you’re working on globally distributed web architectures, users in different locations can sometimes have very different experiences of your site, particularly when pages are being served from different data centres. Some users may get awesome performance while others have to wait ages while pages download agonisingly slowly.

Often it’s not even clear which data centres user are being directed to, particularly if you work in a big organisation where there is a dedicated team responsible for DNS/routing. If you have access to servers in different countries, you may be able to remote in and do DNS lookups from those boxes in order to work out where users are likely to be directed, but if not, you’re going to need another way to work out how the DNS is set up.

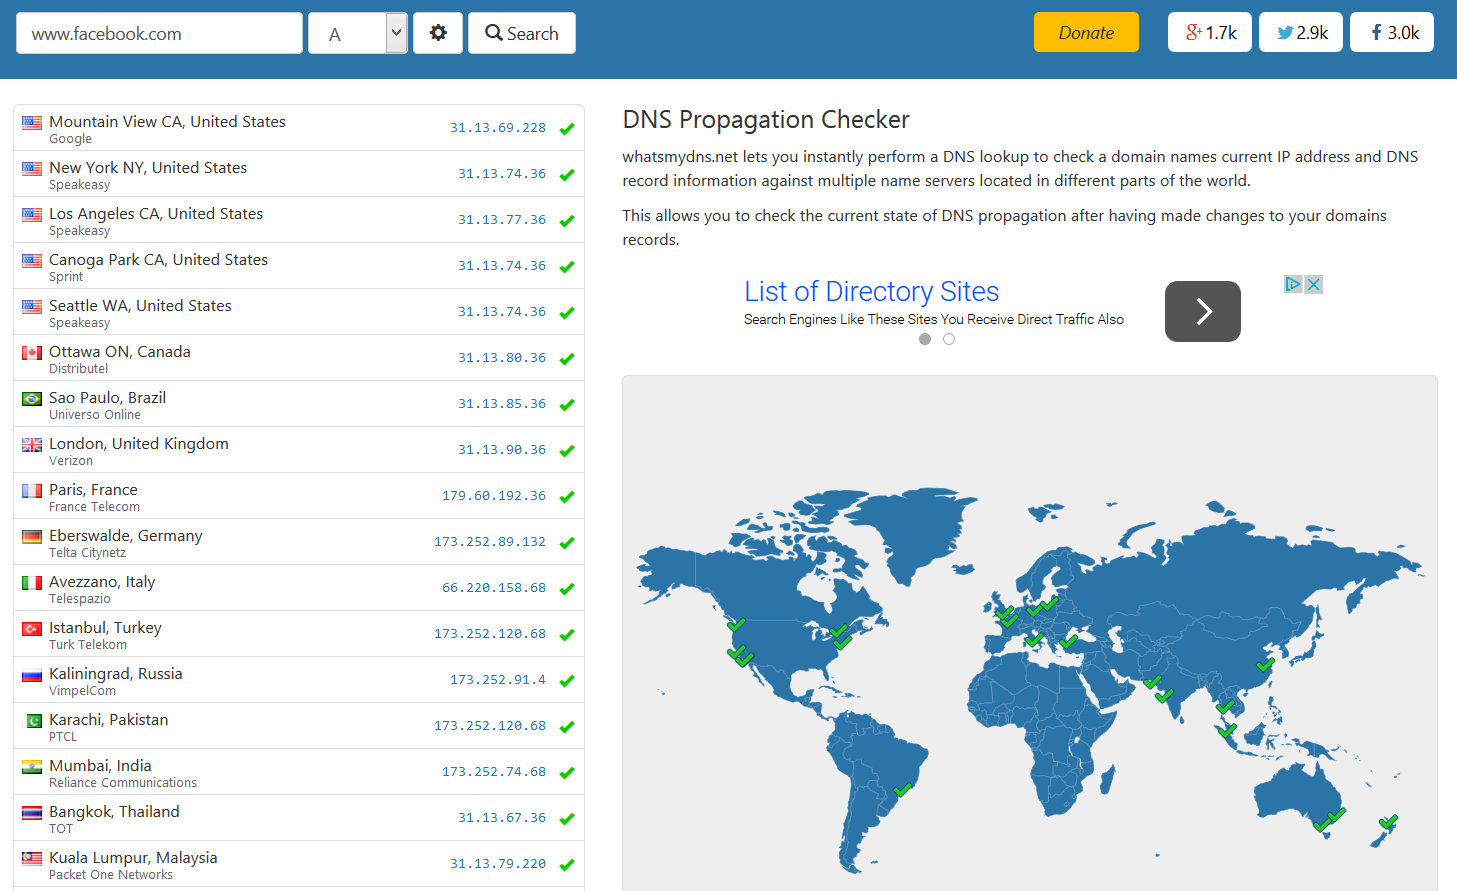
A great way to get a view of DNS settings right across the world is to use What’s My DNS. Simply enter a URL and you will find out which IP addresses it resolves to at different locations right across the globe.

It’s interesting to see how Google and Facebook do DNS.

Facebook What's My DNS

Using Microsoft Log Parser to run queries across multiple IIS log files

It’s often useful to be able to perform queries across multiple log files. A great example is when dealing with IIS log files. I recently had a situation in which I needed to know the average response times and number of requests received for a couple of IIS web-servers in order to troubleshoot an issue we were experiencing. I needed to know the results over a large time period, so this meant collating data across a large number of IIS log files. Fortunately I had a call open with Microsoft and the support engineer I was dealing with told me about the Microsoft Log Parser, which was perfect for this job.

The tool allows you to group together a set of log files in a single location and run queries across them using a SQL-like language. It can be used with any type of file, but comes into its own when used with IIS log files.

Here are some examples of queries I performed using the tool:

Gets the number of hits per hour, grouped by hour, and writes them to a CSV file:

LogParser.exe "SELECT TO_LOCALTIME(QUANTIZE(TO_TIMESTAMP(date, time),3600)) AS Hours, COUNT(*) AS Hits INTO ReqPerhour.csv FROM u_ex*.log GROUP BY Hours ORDER BY Hours " -i:W3C -o:csv

Gets information about response times for the 20 slowest URLs and writes them to a CSV file:

LogParser.exe "SELECT TOP 20 cs-uri-stem, COUNT(*) AS TotalRequest, MAX(time-taken) AS MaxTime, AVG(time-taken) AS AvgTime INTO avg.csv FROM u_ex*.log GROUP BY cs-uri-stem ORDER BY TotalRequest DESC" -i: IISW3C -o:csv

Gets information about response times for the 25 slowest URLs, filtered between a start and end time, and writes them to a CSV file:

LogParser.exe "SELECT TOP 25 cs-uri-stem, COUNT(*) AS TotalRequest, MAX(time-taken) AS MaxTime, AVG(time-taken) AS AvgTime INTO BeforeavgProb.csv FROM u_ex*.log WHERE TO_TIME(time) BETWEEN TIMESTAMP('00:00:00','hh:mm:ss') AND TIMESTAMP('14:00:00','hh:mm:ss') GROUP BY cs-uri-stem ORDER BY TotalRequest DESC" -i: IISW3C -o:csv

Gets all request URLs that resulted in a 500 error:

LogParser.exe "SELECT cs-uri-stem AS FileName FROM u_ex*.log WHERE sc-Status = 500" -i:W3C -rtp:-1

Gets all request URLs that took more than a second to return:

LogParser.exe "SELECT cs-uri-stem AS FileName, time-taken AS Time from u_ex*.log WHERE time-taken > 1000" -i:W3C -rtp:-1

This beast (which I’ve not tested!) appears to bring back a summary of status codes for requests:

LogParser.exe "SELECT to_lowercase(cs-uri-stem) AS URI, SUM([_200]) AS [200s], SUM([_304]) AS [304s], SUM([_302]) AS [302s], SUM([_404]) AS [404s], SUM([_301]) AS [301s], SUM([_500]) AS [500s],SUM([_501]) AS [501s],SUM([_403]) AS [403s],SUM([_206]) AS [206s],SUM([_406]) AS [406s],SUM([_400]) AS [400s], sub(count(*),add([200s],[206s])) as Failures USING CASE TO_STRING(scstatus) WHEN '200' THEN 1 ELSE 0 END AS [_200], CASE TO_STRING(sc-status) WHEN '304' THEN 1 ELSE 0 END AS [_304], CASE TO_STRING(sc-status) WHEN '302' THEN 1 ELSE 0 END AS [_302], CASE TO_STRING(sc-status) WHEN '404' THEN 1 ELSE 0 END AS [_404], CASE TO_STRING(sc-status) WHEN '301' THEN 1 ELSE 0 END AS [_301], CASE TO_STRING(sc-status) WHEN '500' THEN 1 ELSE 0 END AS [_500], CASE TO_STRING(sc-status) WHEN '501' THEN 1 ELSE 0 END AS [_501], CASE TO_STRING(sc-status) WHEN '403' THEN 1 ELSE 0 END AS [_403], CASE TO_STRING(sc-status) WHEN '206' THEN 1 ELSE 0 END AS [_206], CASE TO_STRING(sc-status) WHEN '406' THEN 1 ELSE 0 END AS [_406], CASE TO_STRING(scstatus) WHEN '400' THEN 1 ELSE 0 END AS [_400] FROM ex*.log GROUP BY URI ORDER BY Failures DESC"

The possibilities are endless. Here are some articles I have been recommended which demonstrate alternative queries, starting with two that deal specifically with IIS logs:

IIS Log Parser examples 1
IIS Log Parser examples 2

Here is an example involving more generic text files:

Reading large text files with Log Parser

…and finally, here is some generic information about the Log Parser from Microsoft:

Generic information on Log Parser

Happy parsing!

Are your SSL certificates secure?

SSL encryption is vital when sending sensitive information over the internet from browser to server, but just how secure are your sites? I used to naively believe that all I had to do was whack a certificate on the web-server and all would be well. However, a friend of mine recently had one of their web-sites audited (I won’t name the site for obvious reasons!) and found more holes in their security defenses than a block of Swiss cheese.

As well as the certificate, here are some other things you need to take care of:

  • Protocols (SSL, TLS, PCT and their various version numbers)
  • Ciphers (DES, AES, etc…)
  • Hashes (SHA x, MD5, etc…)
  • Which key exchanges are enabled
  • The order that SSL ciphers are used

Fortunately, help is at hand using these two great tools:

You can use the Qualys SSL Labs SSL Server Test to find out how secure your site is. Just enter your URL in the box and they’ll give you a full report on how secure the SSL for your site is.

If there are issues the IIS Crypto tool from Nartac Software will help you make the right remedial registry changes without having to tinker around in their yourself, thus vastly reducing the possibility you’ll trash your server.

Clever stuff!

Installing two build agents on TeamCity

Other than jogging my memory in the future when I need to do the same thing again, this post adds no value other than to direct people to Marcos Placona’s great blog post on how to run two build agents on the same TeamCity instance. Unfortunately this doesn’t work out of the box so there is some tweaking involved, as you’ll see.

So, without further ado, over to you Marcos…

http://www.placona.co.uk/1327/technology/new-teamcity-agents-the-right-way/

Detecting web-site SPOFs

Web-site development today is a complex business, requiring knowledge of many different technologies and areas. It is becoming increasingly difficult (and costly!) for development teams to have sufficient knowledge in each of these disciplines, and as a result, specialist functions are often delegated to third parties. Some examples are:

  • Images are often hosted by CDNs.
  • JavaScript files such as jQuery and Google Analytics are often also hosted by CDNs.
  • Online payments are taken by third parties.
  • News feeds come from external social media sites.
  • Adverts are supplied by ad-providers.

This results in modern web-sites effectively being “mash-ups” of content taken from all over the internet. This is fine, until the third party providers become unavailable and parts of your site stop working. Worse still, if you’ve coded your site in such a way that your content depends explicitly on certain providers being available, a delay or failure from a third-party can cause your own web-page to white-screen for a period of time, or even indefinitely. These types of issues are known as Single Points of Failure, or SPOFs.

There are ways to mitigate against SPOFs, some examples being to include JavaScript references at the bottom of your HTML (or better still to load the JavaScript asynchronously) and to have fallback code options for when third-party services are not available, such as placeholder images/text. Some companies even employ two CDNs and switch between them to ensure that content always comes from the most available source.

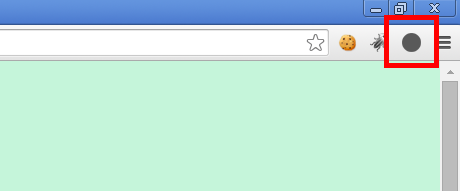
However, before you can do any of this, you need to know whether you’ve got a problem. I recently learnt about a great tool to help diagnose such problems, called Spof-o-matic. I know, it’s an awful name, but the tool itself is very good. It can be added to Google Chrome as an extension, and appears as a grey circle at the top right hand corner of the screen:

Spof 1

If the circle remains grey the site you are on doesn’t have any SPOFs. However, if it changes to a warning triangle, SPOFs have been detected:

Spof 2

Clicking on the circle gives more information about the SPOF (in this case it’s to do with Google Fonts):

Spof 3

…and it’s even possible to simulate the SPOF actually failing so you can find out what effect it would have on your site. A smaller red hexagon in the centre of the original grey circle reminds you that you have enabled this:

Spof 4

There’s also a cool feature to generate videos depicting how your site would be behave if the SPOF should occur, via http://www.webpagetest.org/.

So, before you go live with your new site, run it through Spof-o-matic to make sure your user experience will not be destroyed if third-parties you rely on let you down.

Basic Log4Net step-up

The following post explains how to get Log4Net working in a .NET console application.

The first step is create your console application and add references to Log4Net. The easiest way to add the correct references is via NuGet, where it is simply listed as log4net.

You’ll need to add a configuration file to tell Log4Net how you want it to log. A basic example would be:

<?xml version="1.0" encoding="utf-8" ?>
<configuration>
  
  <configSections>
    <section name="log4net" type="log4net.Config.Log4NetConfigurationSectionHandler,log4net" />
  </configSections>

  <log4net>
    <appender name="RollingFile" type="log4net.Appender.RollingFileAppender">
      <file value="Test.log" />
      <appendToFile value="true" />
      <maximumFileSize value="5000KB" />
      <maxSizeRollBackups value="50" />
      <layout type="log4net.Layout.PatternLayout">
        <conversionPattern value="%utcdate{yyyy-MM-dd HH:mm:ss.fffffff} - %level - %logger - %message%newline" />
      </layout>
    </appender>
    <root>
      <level value="DEBUG" />
      <appender-ref ref="RollingFile" />
    </root>
  </log4net>
  
</configuration>

This example simply adds a rolling log file. It’s called rolling because it starts a new log file at triggered intervals, allowing you to delete historical log files when you’ve finished with them. In this case, a new log file is started each time the current log file gets to 5000KB. It’s worth taking a look at the Log4Net documentation to find out about the different types of logging available. It is also possible to write your own appender if you want to do something not already built it to Log4Net.

In order to tell Log4Net to pick your configuration, you need to add the following to your application:

[assembly: XmlConfigurator]

The most obvious place for this is the AssemblyInfo.cs file.

This tells Log4Net to look in the default configuration file for the Log4Net configuration settings, but you can also tell Log4Net to look in another custom configuration file using the overloads available to the XmlConfigurator, although I prefer to keep all configuration in a single file.

Then it’s just a case of using the logger:

using System;
using log4net;

namespace Test
{
    public static class Program
    {
        public static void Main()
        {
            var log = LogManager.GetLogger(typeof(Program));
            log.Debug("Test console application started");

            Console.ReadLine();
        }
    }
}

Note that the LogManager returns an object implementing the ILog interface.

If you’re using dependency injection, you should wire up the dependency injector to return your ILog instance. The following shows how to do this if you’re using Castle Windsor:

using Castle.MicroKernel.Registration;
using Castle.Windsor;
using Castle.Windsor.Installer;
using log4net;

namespace Test
{
    public static class Injector
    {
        private static readonly object InstanceLock = new object();

        private static IWindsorContainer instance;

        public static IWindsorContainer Instance
        {
            get
            {
                lock (InstanceLock)
                {
                    return instance ?? (instance = GetInjector());
                }
            }
        }

        private static IWindsorContainer GetInjector()
        {
            var container = new WindsorContainer();

            container.Install(FromAssembly.This());

            RegisterInjector(container);
            RegisterLog(container);

            return container;
        }

        private static void RegisterInjector(WindsorContainer container)
        {
            container.Register(
                Component.For<IWindsorContainer>()
                    .Instance(container));
        }

        private static void RegisterLog(WindsorContainer container)
        {
            container.Register(
                Component.For<ILog>()
                    .Instance(LogManager.GetLogger(typeof(Injector)))
                    .LifestyleSingleton());
        }
    }
}

The following statement will return an ILog instance as expected:

var log = Injector.Instance.Resolve();

There you have it!

The Problem Steps Recorder

On a Windows machine, if you try to run PSR.exe (by using CTRL+R, or by searching for a program called Steps Recorder), a rather inconspicuous tool with a record button appears:

Problem Steps Recorder

Clicking Start Record, performing some actions with the mouse or keyboard and then hitting Stop Record produces a step-by-step log of all user input, along with some very useful screenshots showing what was on the screen at the time.

How cool is that? So, next time you ask a tester to give you a bug re-pro, suggest they use the Problem Steps Recorder.

Apparently it’s been around since Windows 7, so hopefully most people will have it on their work computers.

Geeky Google Analytics

Google Analytics is awesome, there is no doubt about it. It’s easy to integrate into websites and the UI to get metrics information out of is pretty cool too, especially the real time stuff which now seems to work better than ever. However, when I’m asked particularly complex metrics-based questions by guys I develop sites for I often find it difficult to get exactly the information I need from the standard Google Analytics UI.

Instead, I find the Google Analytics Query Explorer 2 tool useful. It’s not pretty, but it allows me to build up complex analytics queries in a single screen without having to search around for filters and options. It feels more like writing SQL against Google’s Analytics store rather than battling with the standard UI they wrap around the numbers. I wouldn’t be surprised if the default UI uses the Query Explorer behind the scenes to get at the numbers either.

Enjoy!

Essential FireFox add-ons for web-developers

Although Chrome seems to be winning the browser wars these days, I still like to develop against Firefox first and then tweak/hack CSS for compatibility with other browsers afterwards. I do this because I believe that Firefox most closely adheres to the HTML and CSS standards when it renders sites. I’m pretty sure that this belief used to be true, but I’m not certain if it’s technically correct today. However, as an approach it still seems to work pretty well. I’d be interested to hear your views on this.

I thus know more about Firefox add-ons than add-ons for other browsers. Here is my list of essential Firefox add-ons, which I’ll keep up-to-date:

Firebug

Totally essential for web-developers. Does pretty much everything you’ll ever need, from on-the-fly HTML and CSS tweaks, to JavaScript debugging, to monitoring network calls and cookies, and much, much more.

Web Developer by Chris Pederick

If you do find something that Firebug doesn’t do, there’s a fair chance that Chris Pederick has thought of it and included it in his web-developer toolbar. Worth getting alone because it makes it ridiculously easy to enable/disable JavaScript and CSS without having to remember where the options are hiding in the standard Firefox options. It does some other neat things too though, like highlighting elements of certain kind and showing outlines, which are invaluable if you want to get everything to line up nicely.

iMacros

Not really a developer tool, but a great tool for recording and replaying macros in Firefox. I tend to use it to log in to sites that have laborious access procedures or have auto-complete disabled.

User Agent Switcher

Another one from Chris Pederick, and very useful for testing out different user agents with your code. When used in conjunction with the re-size feature in the Web Developer toolbar mentioned above, you can get your sites in a pretty good state to work on mobile devices, before testing on the devices themselves.

SAML Tracer

Useful when working with SAML based single-sign on solutions, which I’ve been doing lately with ADFS.

That’s all for now folks!

Planning Poker

During agile projects it is common for teams to estimate the “size” of each user-story being considered for inclusion in the next development sprint by committee. This involves each team member assigning a number of points to each user-story. It is usual to restrict number choices to the Fibonacci numbers. Many teams do this using special “planning poker” card decks, allowing each team member to select a card from their own deck in private, prior to everyone revealing their cards at the same time.

However, with the increase in popularity of home working it is not always possible to have all team members in the same room to facilitate an estimation session.

PlanningPoker.com is a great (and free!) website that allows teams to play planning poker online. User stories are loaded in to the tool in advance, and then iterated through one at a time. Participants are allowed some time for discussion, during which each should choose a card. Once everyone has chosen the cards are revealed allowing a consensus to be reached.